A dashboard to get insights in your e-mail deliveries
The broadlog insights dashboard will analyse your broadlog tables every night to collect information about your volumes. It does this by grouping per hour and targeting dimension. By default recipient and visitor is available. In case you don't use visitors, you will need to install the modified package as we can't reference tables that don't exist. When you use other dimensions, you'll need to add them. Both is doable, but it'll require some development. The dashboard is based on this custom table as we don't want to consult the broadlog tables every time someone consults the dashboard.
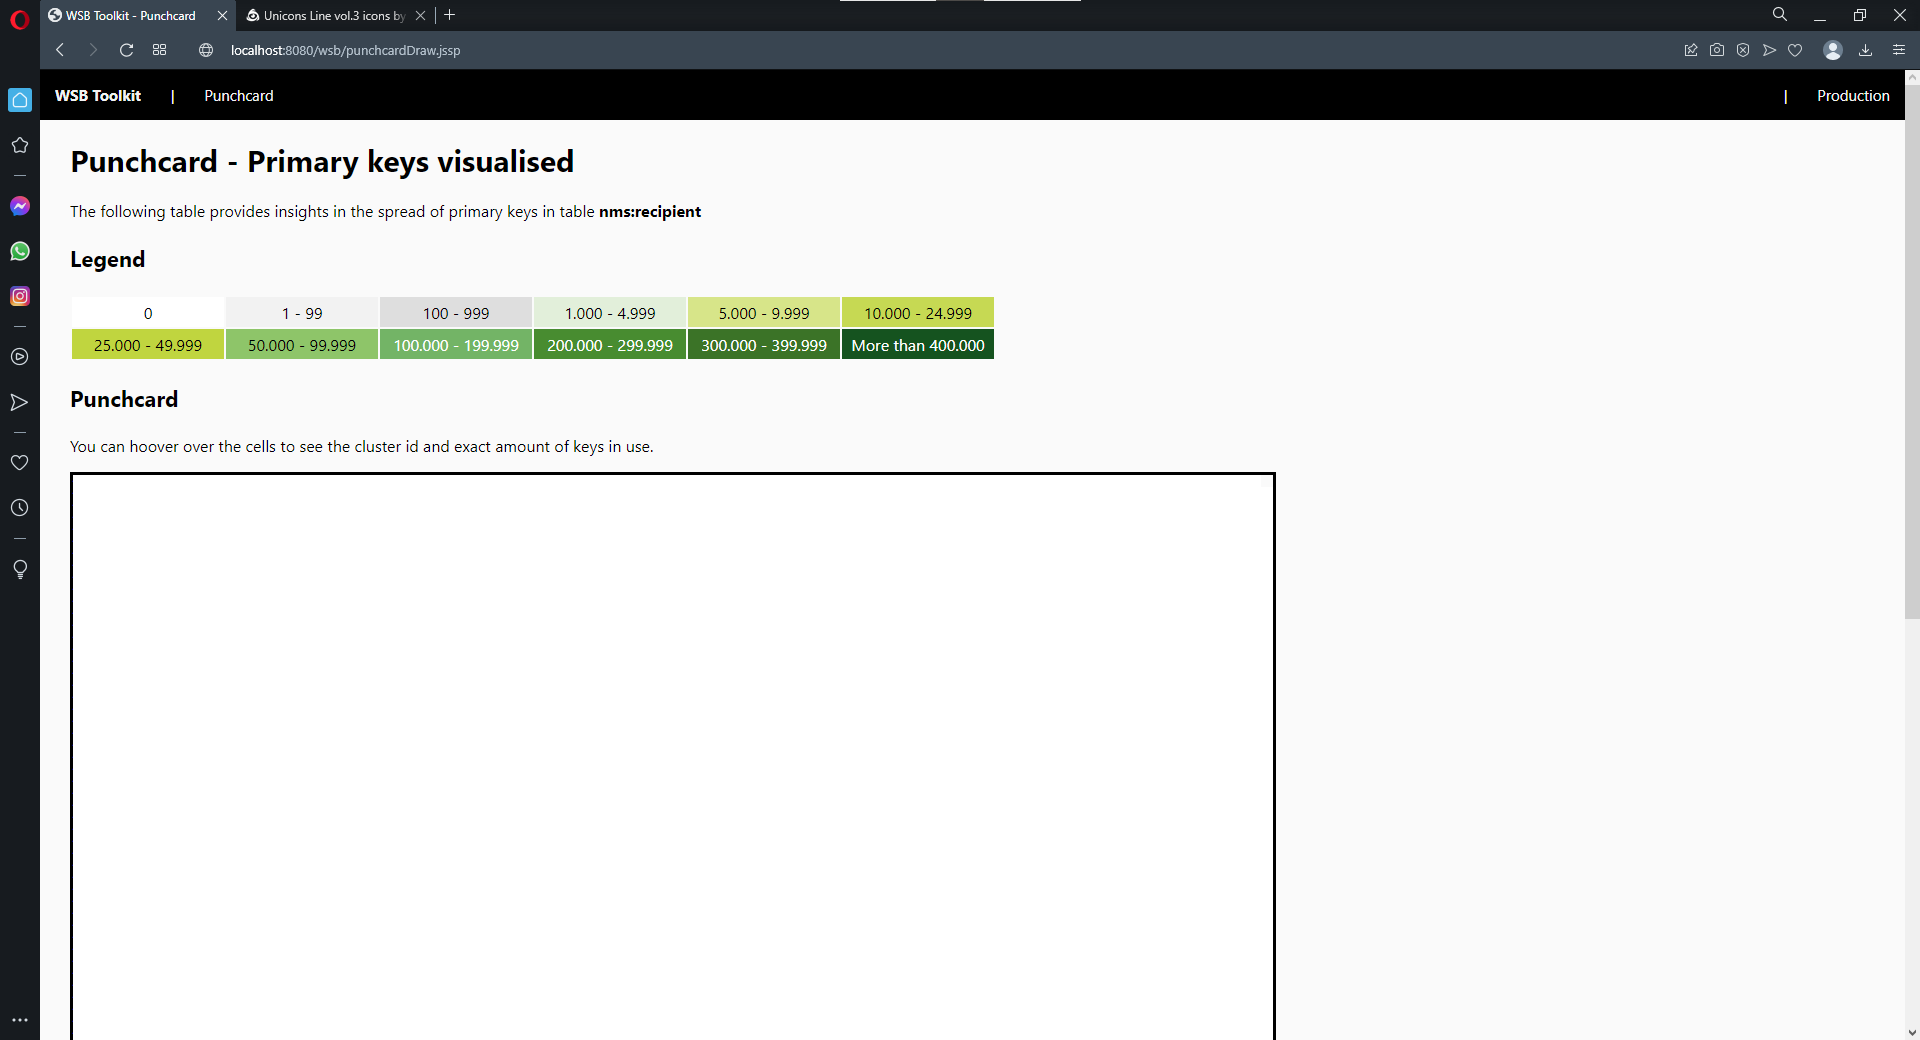
The dashboard provides you insights in the last 30 days, the hours anda days you are sending your e-mails, and it'll give some advice about the volume you shouldn't exceed to safeguard your e-mail reputation.
When you install the broadlog insights package, the following objects will be created.
Click the button below to download the package
This feature requires the Acato Core package to be installed
 This feature relies on ChartJS!
I need to start with a big warning. It's my goal to develop all features by solely relying on out-of-the-box components, but for this dashboard I had to make an exception. As far as I know, the only realy way to add charts natively to Dynamic JavaScript Pages (JSSP), is by creating reports and including those as iFrames. Despite this works, the charts available in the reports module are fairly limited. It would also require me to create a report for each graph, which I didn't liked. Therefore I'm relying on chartjs, an open-source JavaScript library that allows you to render charts without a lot of efforts.
On top of the JSSP page you'll see 2 script tags that load the chartjs libraries from an official CDN. An integerity hash has been added to avoid compromised libraries to be loaded. If you organisation doesn't allow you to reference external sources for security reasons, you can download them from the official channels and serve them yourself. I'm using version 4.0.1.
I've experimented with creating JSSP pages in Adobe Campaign to server the chartjs libraries, currently not succesful as pasting the content of the UDM file makes the client crashing. But in theory it's possible.
You can simply download the package using the link above and install it on your instance. Be however informed that this feature requires the springboard to be installed. I recommend you to re-install the springboard whenever you install a new feature that relies on it, this to make sure you have the latest version of the springboard and it's global supportive libraries (like CSS).
Once you've installed both packages, make sure to run the database update wizard - despite it should have been executed upon package installation. Next, check the "WSB Toolkit" workflow folder under Administration > Technical workflows. Look for the broadlog insights workflow and start it. I don't advise to trigger it manually, the JS code might create double records, just wait until midnight.
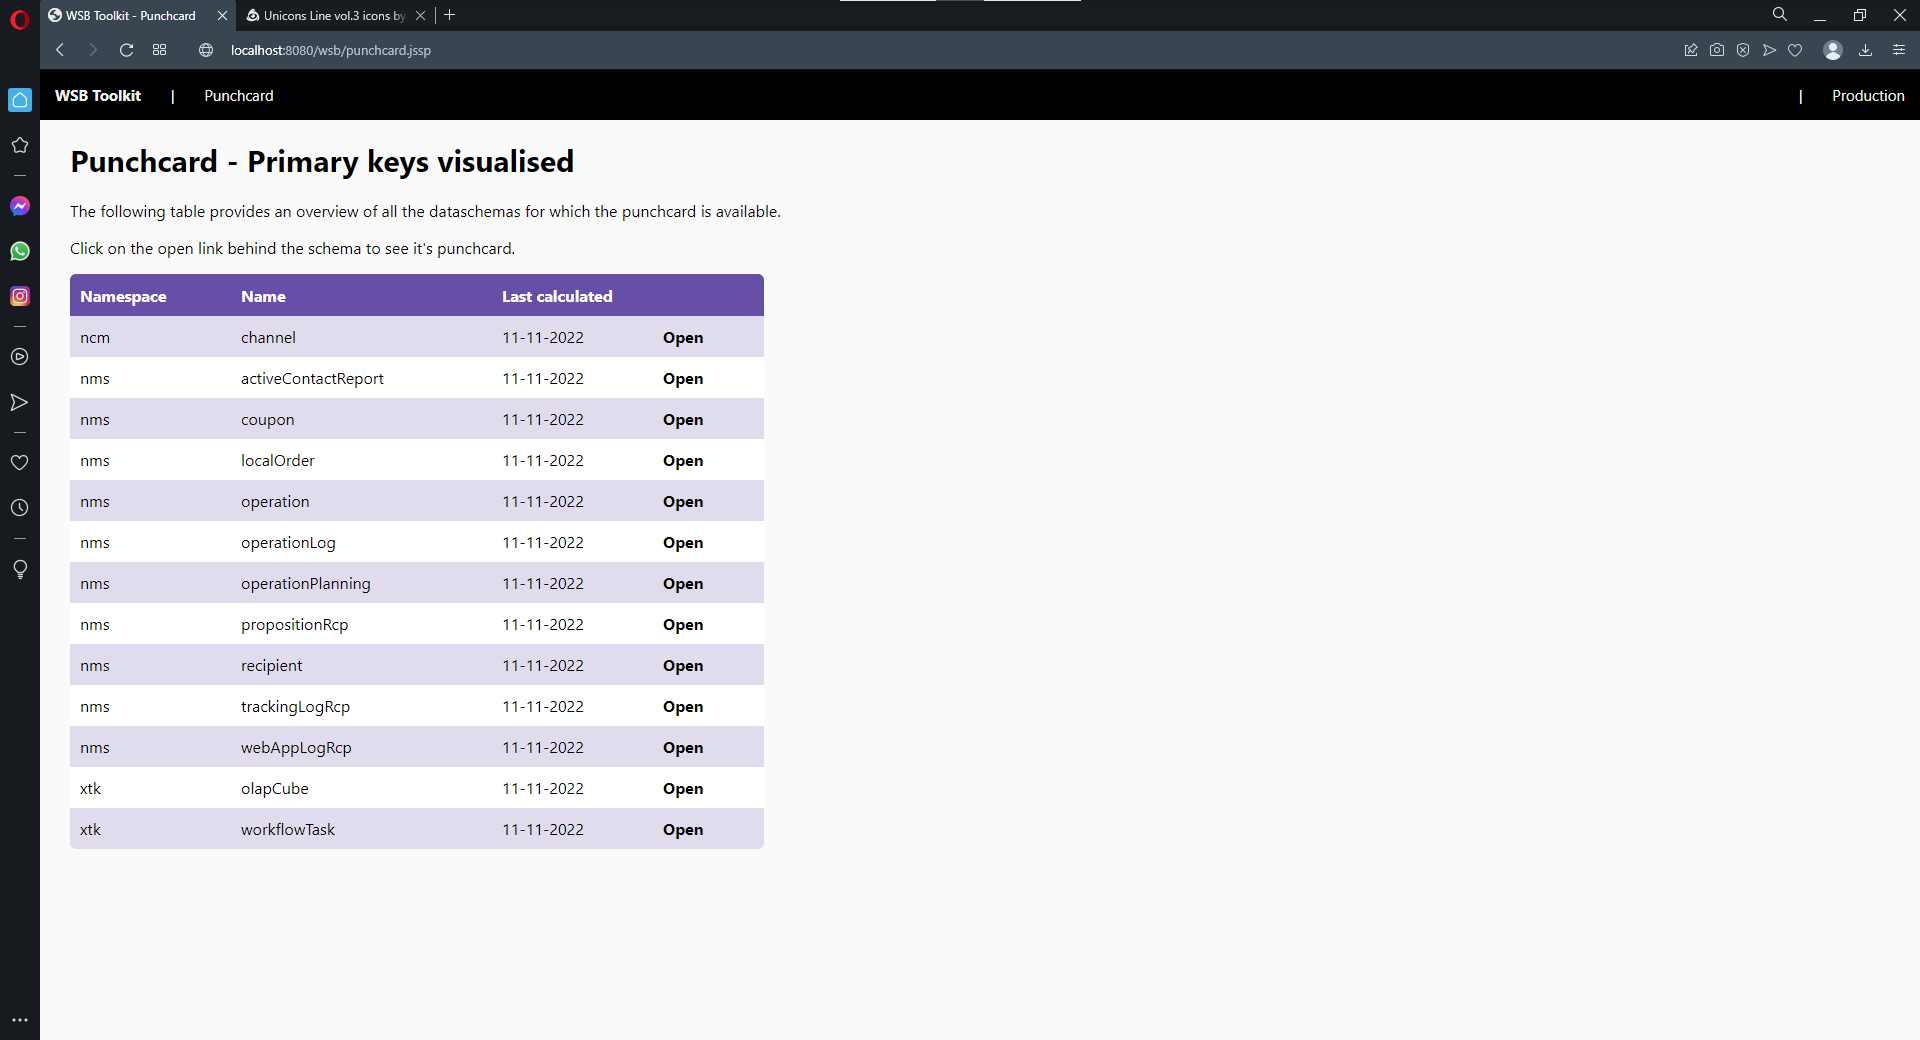
Now go to the JSSP page in your browser. The url of your server you'll need to construct yourself, but as a reference, use this one: https://localhost:8080/wsb/broadlogInsights.jssp
You might need to play around with http(s) and the port.
Please be aware that you need data for the charts. The workflow on looks back 5 days so let it run a few days.
I know, you want to use this dashboard immediately. Well, in theory you can duplicate the workflow and remove the date condition. The fact that the JS is creating a record for every hour might not be stricktly necessary, but can cause your data to not be exactly what it should be. To have a good starting point, you should populare the broadlogInsights table this dashboard uses with 24 records - one for each hour, so 0 to 23 (designed in Europe, so sorry for the AM/PM fans) - for every day till the oldest record in your broadlog table. So if you keep your delivery logs for 180 days, you need 24 x 180 records. I'll give you the script you need:
Sample text. Lorem ipsum dolor sit amet, consectetur adipiscing elit, sed do eiusmod tempor incididunt ut labore et dolore magna aliqua. Sit amet tellus cras adipiscing enim. Ut porttitor leo a diam sollicitudin. Turpis in eu mi bibendum neque egestas congue quisque egestas. Viverra adipiscing at in tellus integer. Blandit volutpat maecenas volutpat blandit aliquam etiam erat velit. Lectus sit amet est placerat in egestas.
This feature has been designed to support both recipient as visitor. In case you don't use the visitor system or you have an extra targeting dimension with own broadlog tables, follow the steps below.
I've done the work for you. We'll need a workflow not checking the visitors broadlog tables. All the rest can remain the same. This means that in the dashboard you'll see visitor references, but they'll always be 0. You can remove them, but I advise not to. It's useless work and once you do enable the visitors, you'll need to undo all changes. So just install the modified package. Only difference is thus the workflow.
We'll need to make some changes. It's a bit of work, but it's not that hard if you can smart copy things.

The dashboard can help improve your deliverability score when you take into account the following points.
The advised volume is the average volume you've sent the last 30 days.
Why? A steady volume is better for your reputation. The charts should look boring.
The reputation safe volume is your maximum of the last 30 days plus 19%.
Why? A huge increase harms your reputation as it looks like a spammer.
The source code of this feature is available on Azure DevOps
Find out moreYou can use it all for free, but you need to be aware of the following


This website is using essential cookies to improve your experience. By using this website, you agree with the use of these cookies. More info.